Regression Lines and Estimation
Scope Label
Core 9758. Regression lines, line selection, interpolation, extrapolation, and reliability of estimates are core parts of correlation and linear regression.
Role in the Topic
This branch starts after the scatter diagram suggests that a linear model is sensible.
Use it with:
Regression as Best-Fit Modelling
A regression line is a best-fit line used to estimate one variable from another.
The phrase “best fit” is made precise by least squares.
For regression of on , the line is chosen to minimise the sum of squared vertical errors.
If is the fitted value, the vertical residual is
and least squares minimises . Squaring prevents positive and negative residuals cancelling and penalises large errors. Regression of on uses the analogous horizontal residuals.
For regression of on , the line is chosen to minimise the sum of squared horizontal errors.
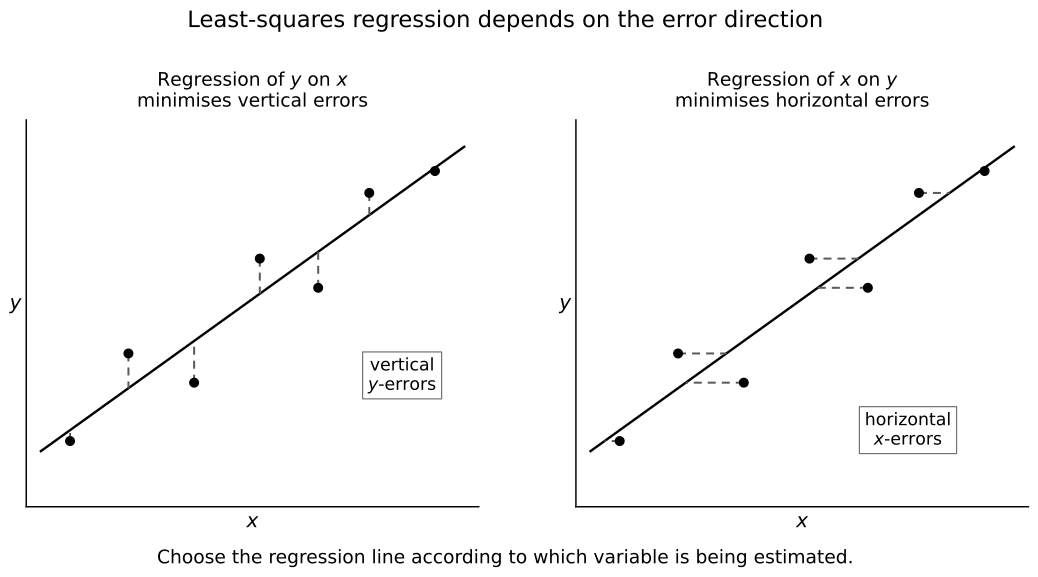 How to read this figure. The residual direction defines the fitted line. Use a known dependence direction first; only when no direction is known should the variable being estimated determine which residuals are minimised.
This is the key reason the two regression lines usually differ.
Regression of on
The regression line of on is used when is modelled or estimated from .
It has the form
or equivalent calculator notation.
This line treats as the explanatory or input variable and as the response or output variable.
If the fitted line is
then the gradient means:
for each one-unit increase in , the predicted value of changes by approximately units.
The intercept is the predicted value of when , but it should only be interpreted if is meaningful in context and not far outside the observed data range.
Regression of on
The regression line of on is used when is modelled or estimated from .
It has the form
If this line is later rearranged to draw it on usual - axes, it is still the regression line of on . The direction of least-squares error has not changed.
Choosing the Correct Regression Line
The safest question is:
Which variable is being modelled as depending on the other?
If the context gives a dependence direction, follow it.
| Context | Suitable model |
|---|---|
| depends on | regression of on |
| depends on | regression of on |
| no clear dependence, estimate from | regression of on |
| no clear dependence, estimate from | regression of on |
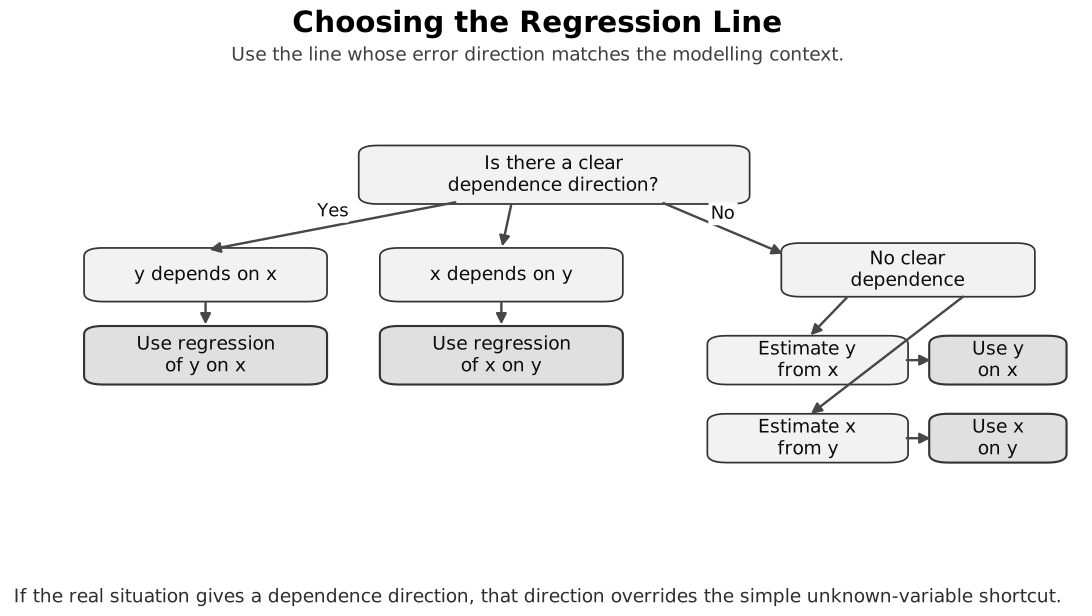 How to read this figure. Start with known dependence direction. Only when neither variable naturally depends on the other should the variable being estimated determine the regression direction.
The subtle case is calibration. If an instrument reading depends on the true concentration , the modelling direction may still be on even when the question asks for from a given reading.
Mean Point
Both regression lines pass through
This point is the centre of the bivariate data.
Formula insight (derivation not required). With , , and , the -on- slope is and its intercept is . The -on- slope is . These forms explain why both lines pass through ; calculator use remains the core procedure.
These formulae require for regression of on and for regression of on . If all -values are equal, the -on- slope is undefined; if all -values are equal, the -on- slope is undefined.
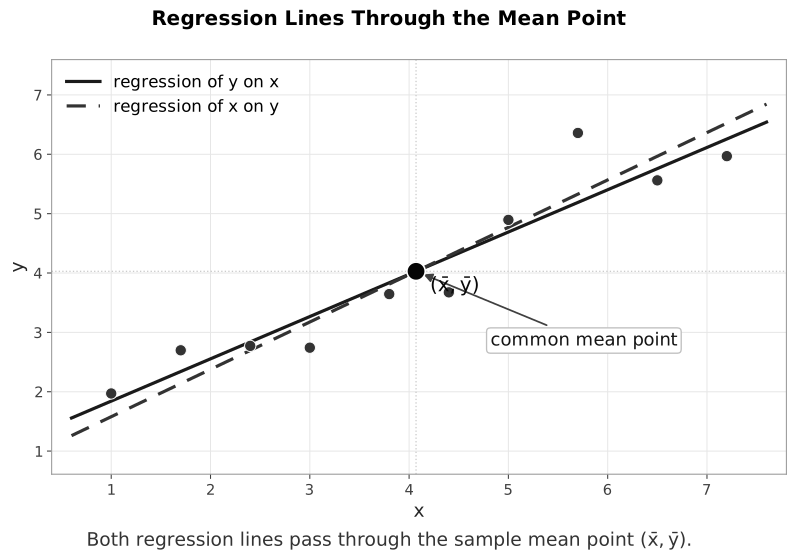 How to read this figure. Both fitted lines must pass through , but that property alone does not identify which line is on or make the two lines interchangeable.
The stronger the linear correlation, the closer the two regression lines are. If or , all points are collinear and the two regression lines coincide.
For , the regression line of on , rearranged into finite-gradient form, is steeper in absolute value than the -on- line. If , the lines coincide. If , the lines are and ; the latter is vertical and cannot be rearranged into finite-gradient form.
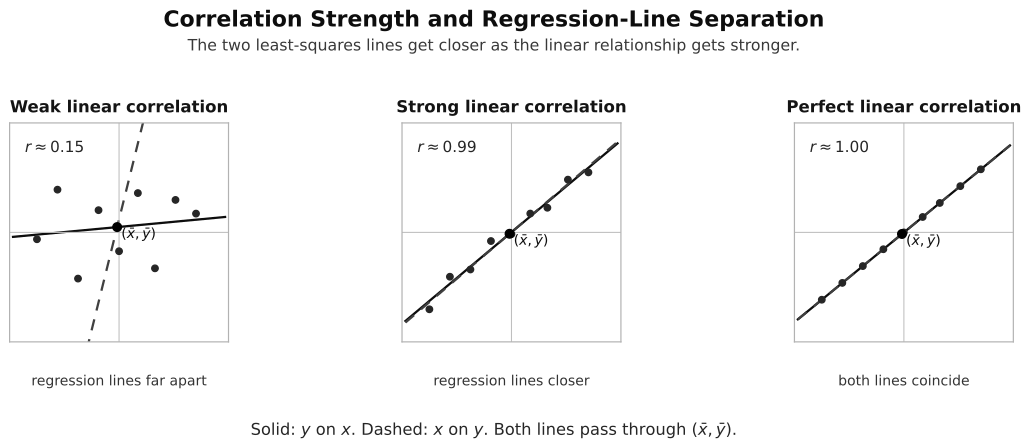 How to read this figure. For , stronger linear correlation brings the two lines closer. At they coincide; at the two regression lines are horizontal and vertical through the mean point.
Interpolation and Extrapolation
An estimate is interpolation if the input value lies within the observed data range.
An estimate is extrapolation if the input value lies outside the observed data range.
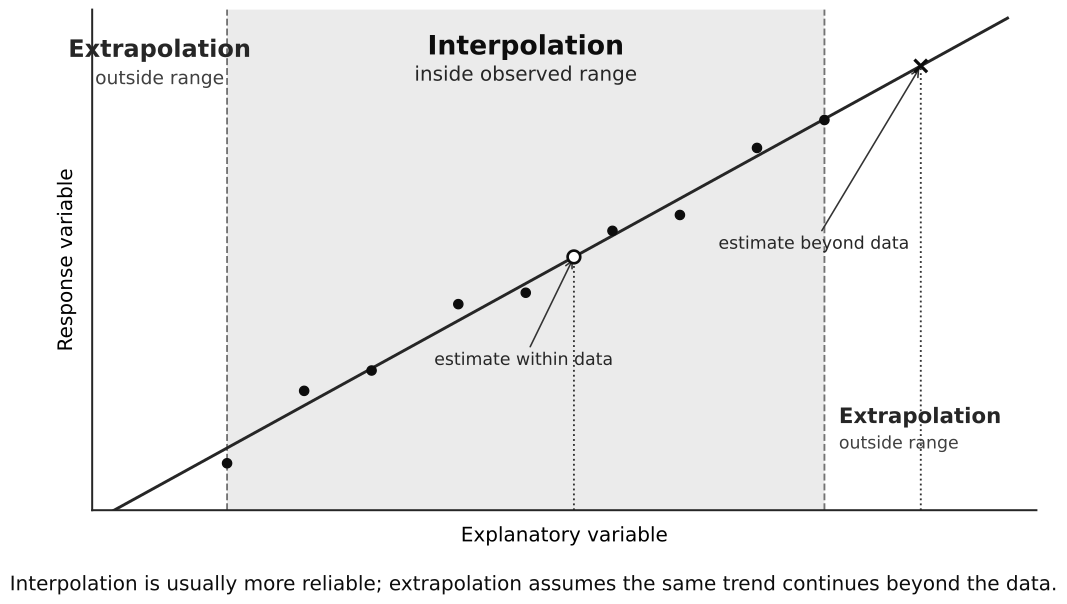 How to read this figure. Interpolation avoids assuming that a trend continues beyond the observed predictor range, but it still requires a suitable linear model. Extrapolation needs high caution even when is large.
Interpolation is generally more reliable because it stays within the evidence supplied by the data.
Extrapolation assumes the same relationship continues outside the observed range. That assumption may be false even when is close to within the sample.
Reliability of Estimates
To judge reliability, ask:
- Is the input value within the observed data range?
- Is the scatter diagram roughly linear?
- Is close to ?
- Are there outliers or clusters that weaken the model?
- Does the estimate make sense in context?
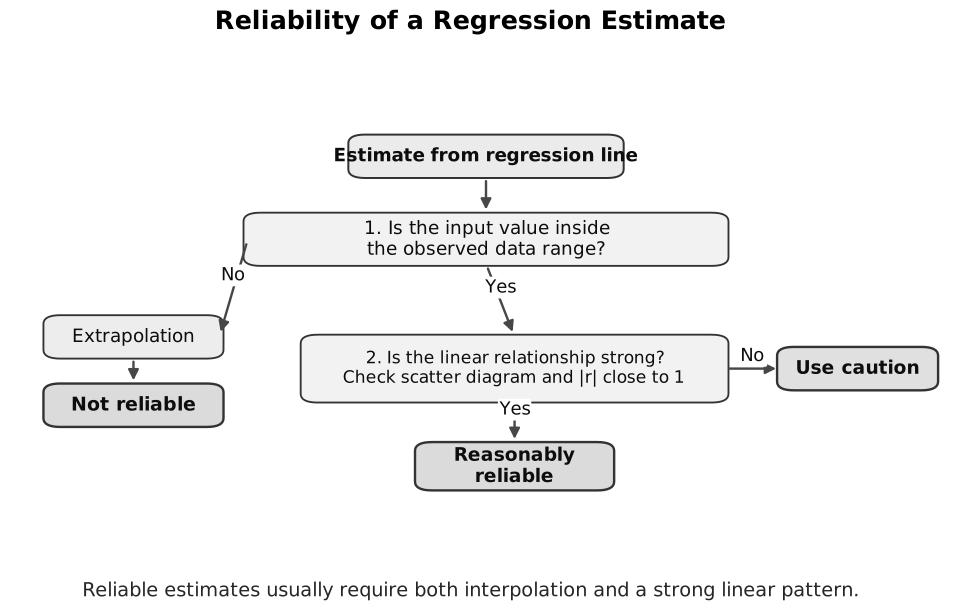 How to read this figure. These checks make an estimate more defensible, not guaranteed correct. Name the predictor range being checked, inspect curvature/outliers/clusters, and apply contextual judgement.
A good reliability statement names both range and linear strength:
The estimate is likely to be reliable because the input is within the observed range and the scatter diagram shows a strong linear pattern.
or:
The estimate is not reliable because it is extrapolation beyond the observed data range.
Core Example: Choosing a Line
Suppose is a machine reading and is the true concentration of a chemical. The machine reading depends on the true concentration.
If the question gives a machine reading and asks for the concentration, it may seem natural to use the regression line of on .
But if the modelling relationship is
then the regression line of on may be the correct calibration model. After fitting it, solve the equation for .
The reason is not algebraic convenience. It is that the reading error is in .
Core Example: Reliability
Suppose the observed -values range from to , and the regression line is used to estimate when .
This is interpolation, so it may be reasonable if the scatter diagram is roughly linear and is close to .
If the same line is used at , the estimate is extrapolation. It should be treated as unreliable unless there is strong external justification that the same linear pattern continues.
Core Example: Complete Regression Workflow
Consider the original paired data
| 1 | 2 | 3 | 4 | 5 | |
|---|---|---|---|---|---|
| 2.2 | 3.9 | 5.8 | 8.2 | 9.9 |
A calculator gives (coefficients are displayed here to suitable accuracy; retain the stored calculator values for computation),
with . Since , both equations pass through the mean point.
If there is no known dependence direction, estimating at uses the -on- line and gives . Estimating at uses the -on- line and gives . Both are interpolation.
If context instead says is an instrument reading that depends on true input , the calibration model remains on . For a reading , solve to obtain .
Keep calculator coefficients at full precision during substitution and round only the final estimate. Premature coefficient rounding can shift the reported answer.
Common Pitfalls
- Choosing the regression line only by looking at which variable is unknown.
- Forgetting that context may determine the dependence direction.
- Treating the two regression lines as interchangeable.
- Rearranging and forgetting it is still regression of on .
- Forgetting both regression lines pass through .
- For , forgetting that the rearranged on line has a larger absolute gradient than the on line on usual axes. At , that rearranged line is vertical and has no finite gradient.
- Interpreting an intercept even when is outside the meaningful context.
- Calling an extrapolated estimate reliable just because is close to .
- Ignoring outliers or curvature when using a regression line.
Revision Checklist
- Can you explain why regression of on minimises vertical errors?
- Can you explain why regression of on minimises horizontal errors?
- Can you choose the correct regression line from the context?
- Can you explain why both regression lines pass through ?
- Can you interpret the gradient and intercept of a regression line in context?
- Can you distinguish interpolation from extrapolation?
- Can you write a reliability sentence that mentions both range and linear strength?